Introduction
We collect a lot of data throughout our system such as playback analytics, user purchases and ingestion data, all of which are made available through our APIs and Customer Portal. You will find here all the necessary information to visualize and retrieve that data using our datapoints and groupings.
The APIs
The APIs are responsible for serving interesting insights collected from the users of your service.
We currently offer 2 APIs for retrieving analytics data from our system. The Analytics API allows you to explore data using numerous datapoints and slicing this data using specific groupings to get just the report that you want. The Data Export API allows you to fetch the raw events and aggregated sessions that are used to build the reports in the Analytics API.
Documentation for the APIs can be found at Analytics API Open API Docs while direct access to the API (for integrating with services) can be found at Analytics API entrypoint.
Insights
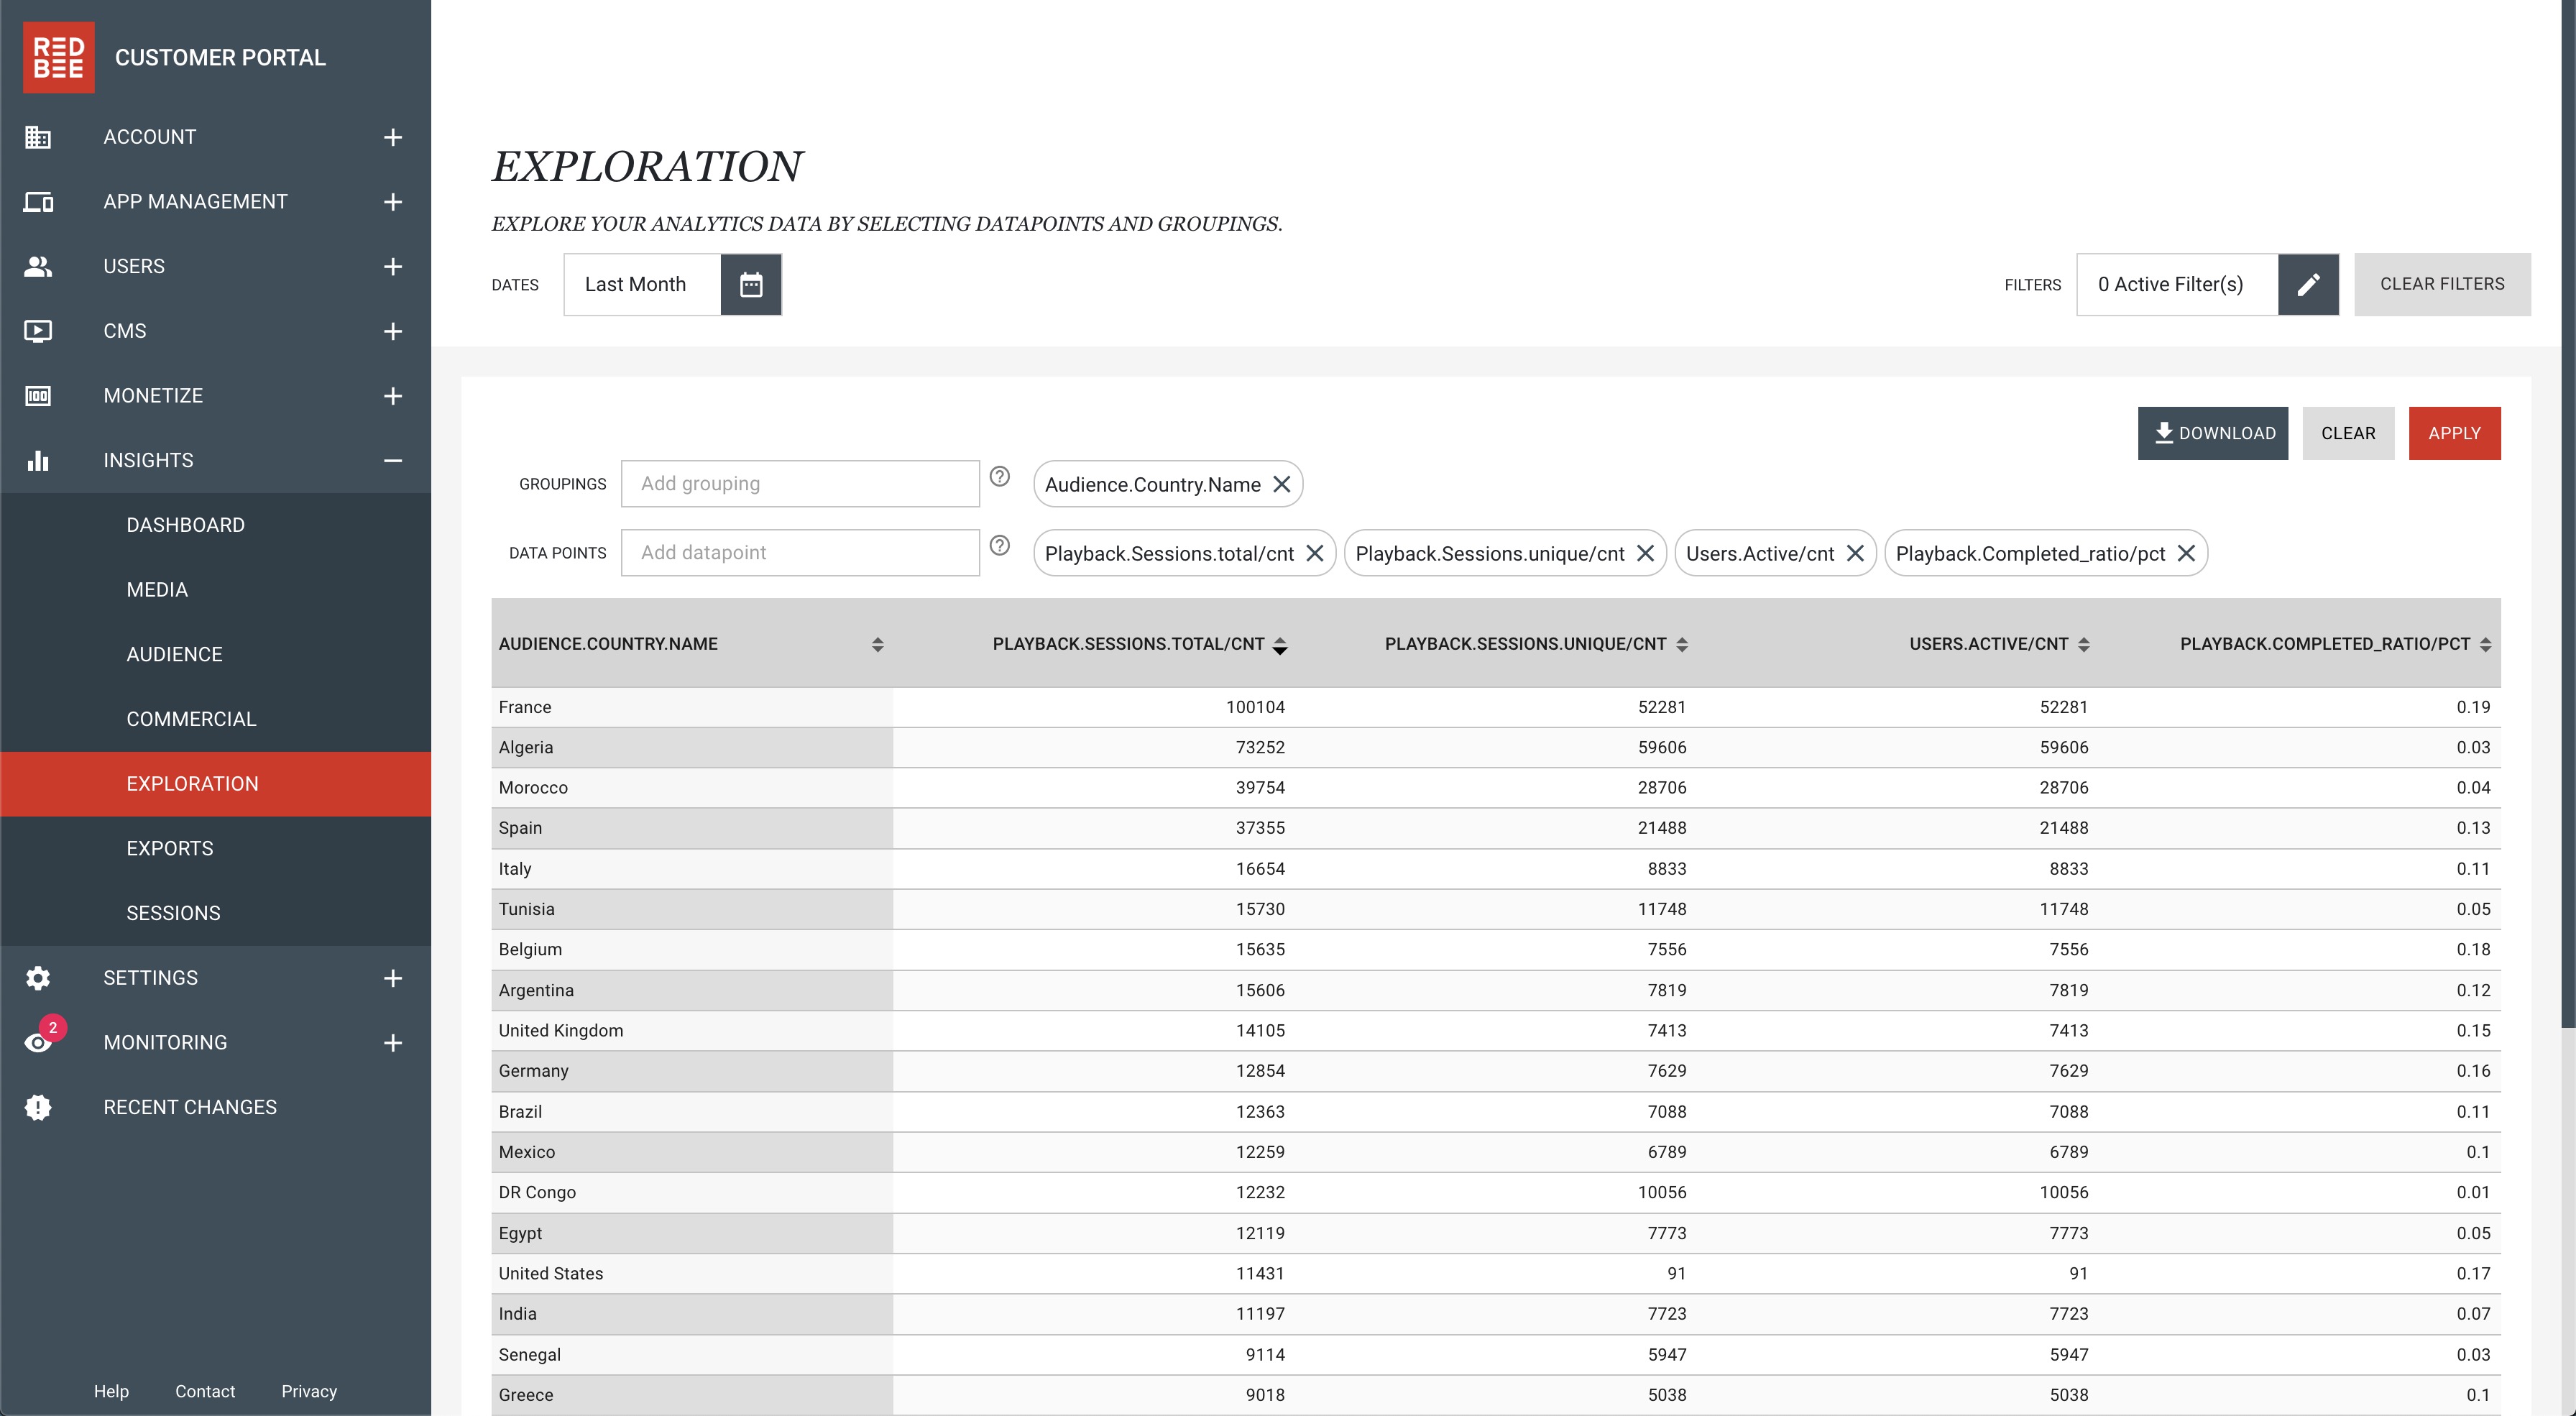
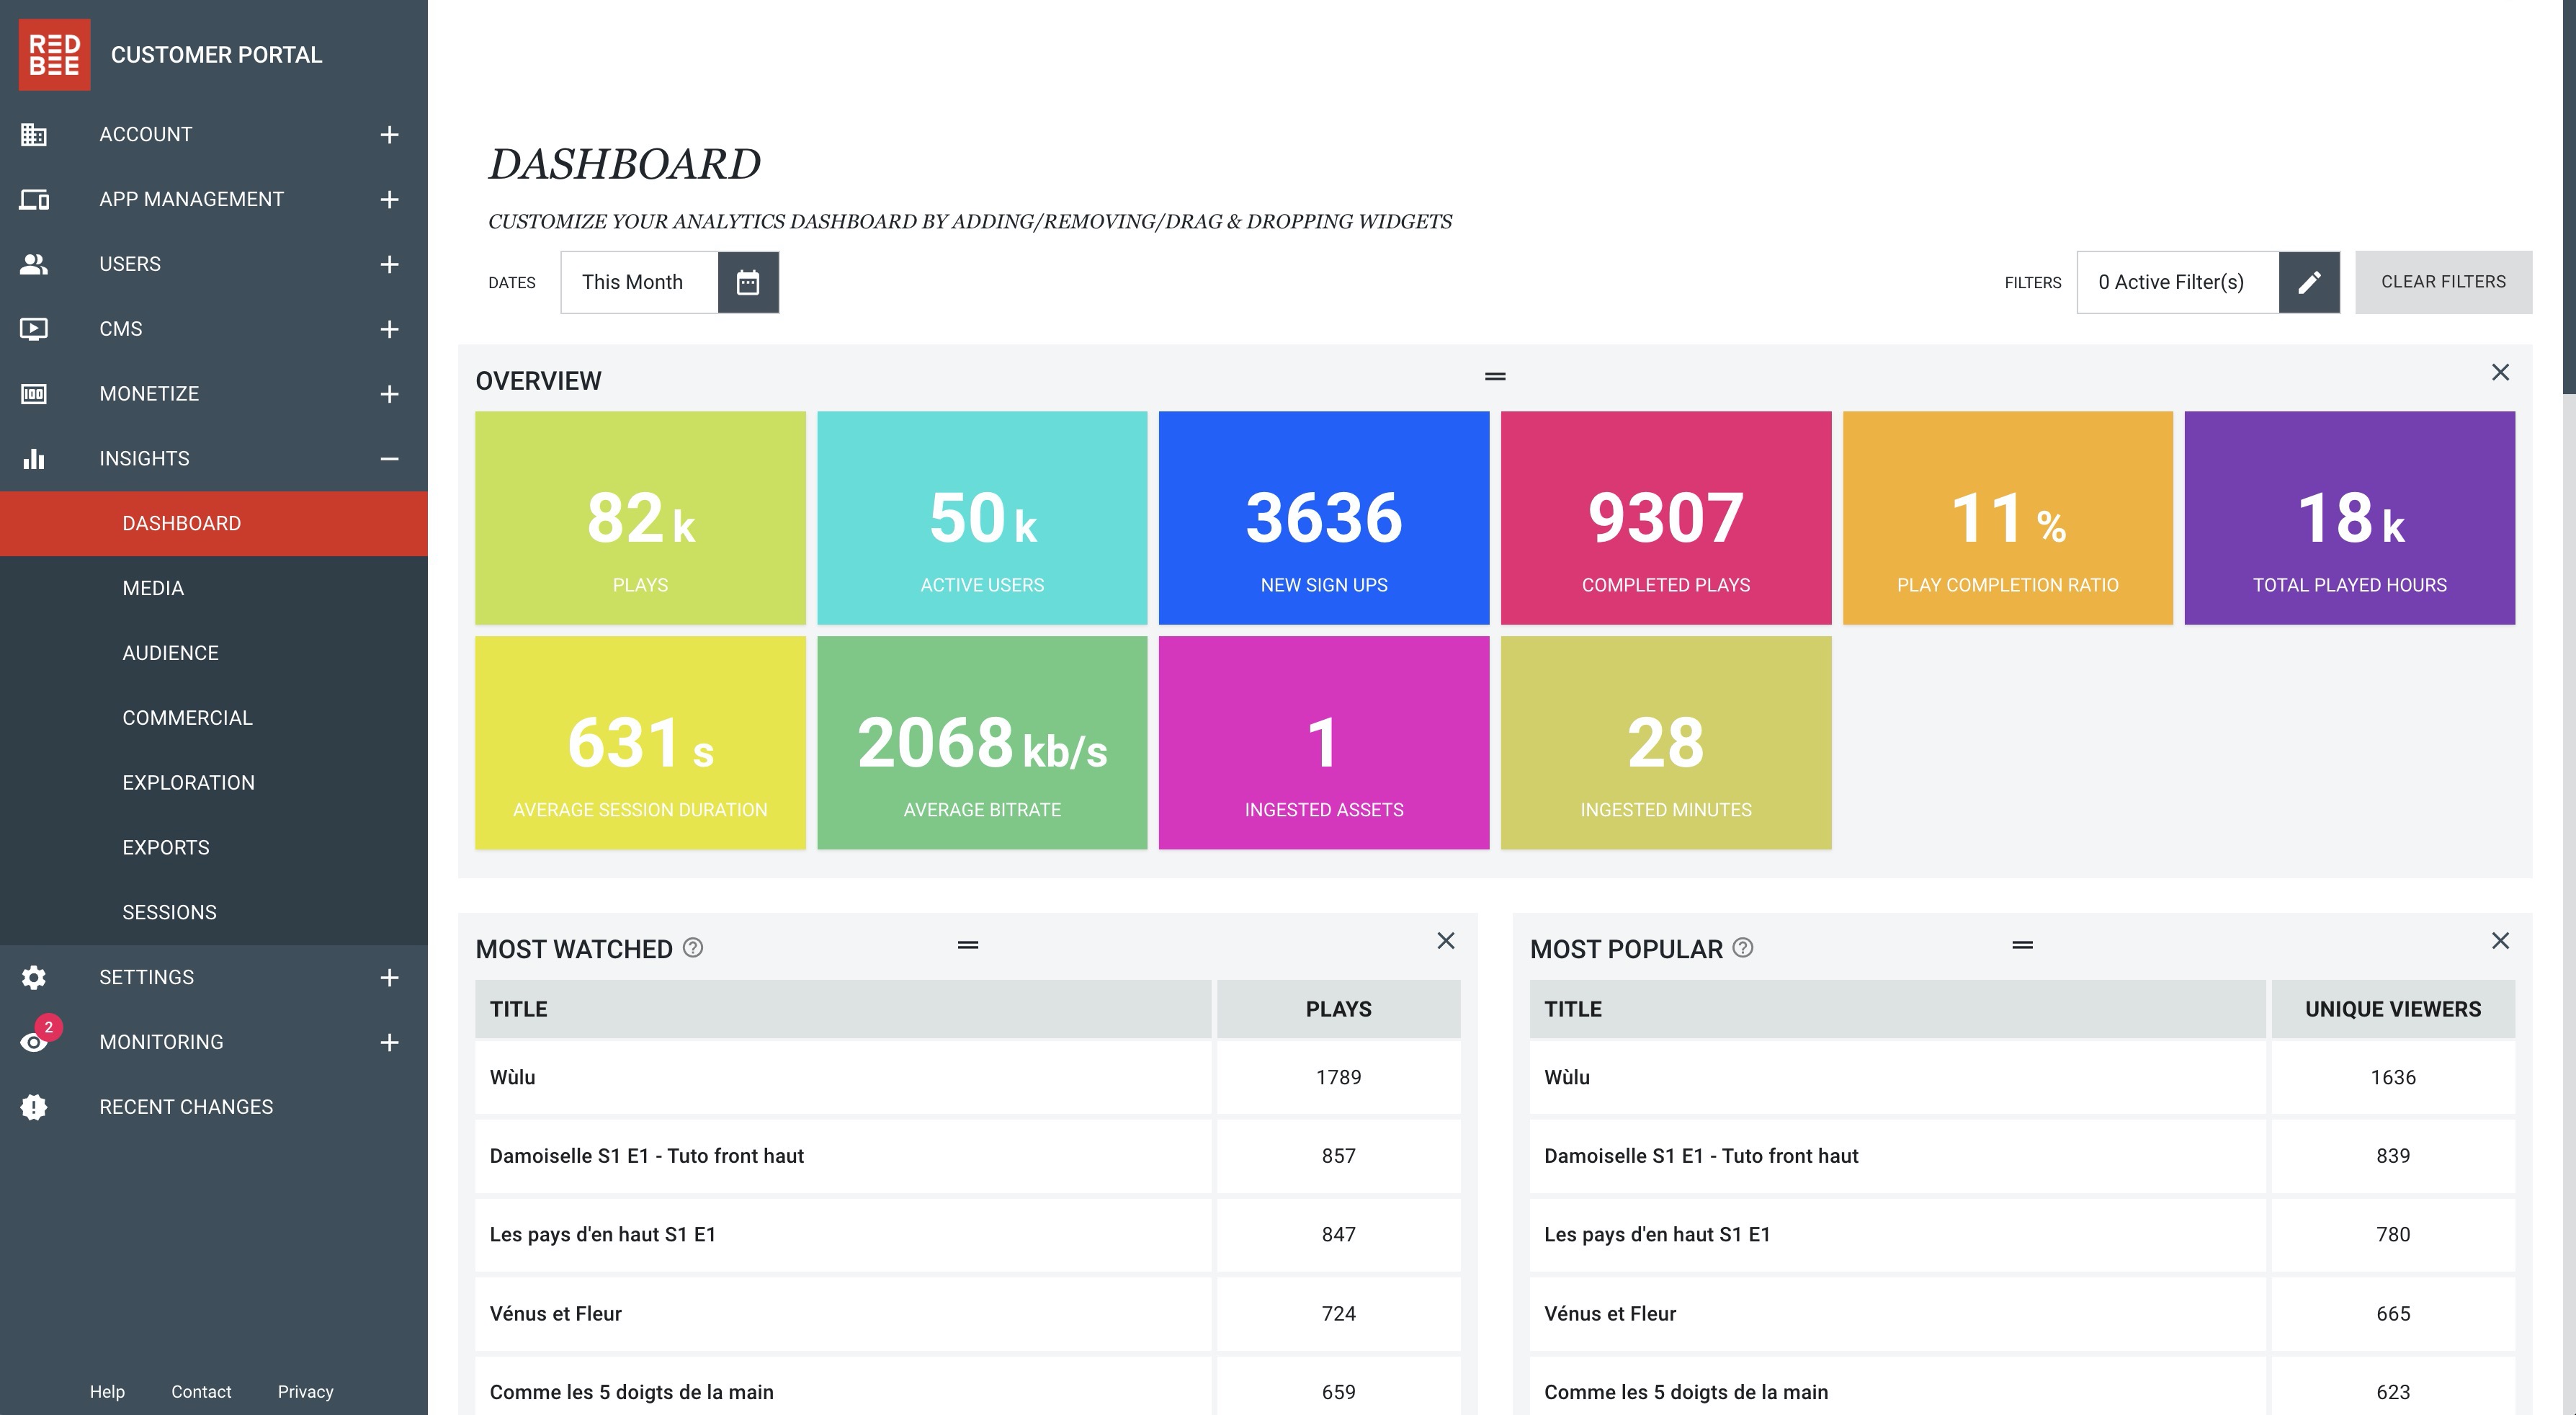
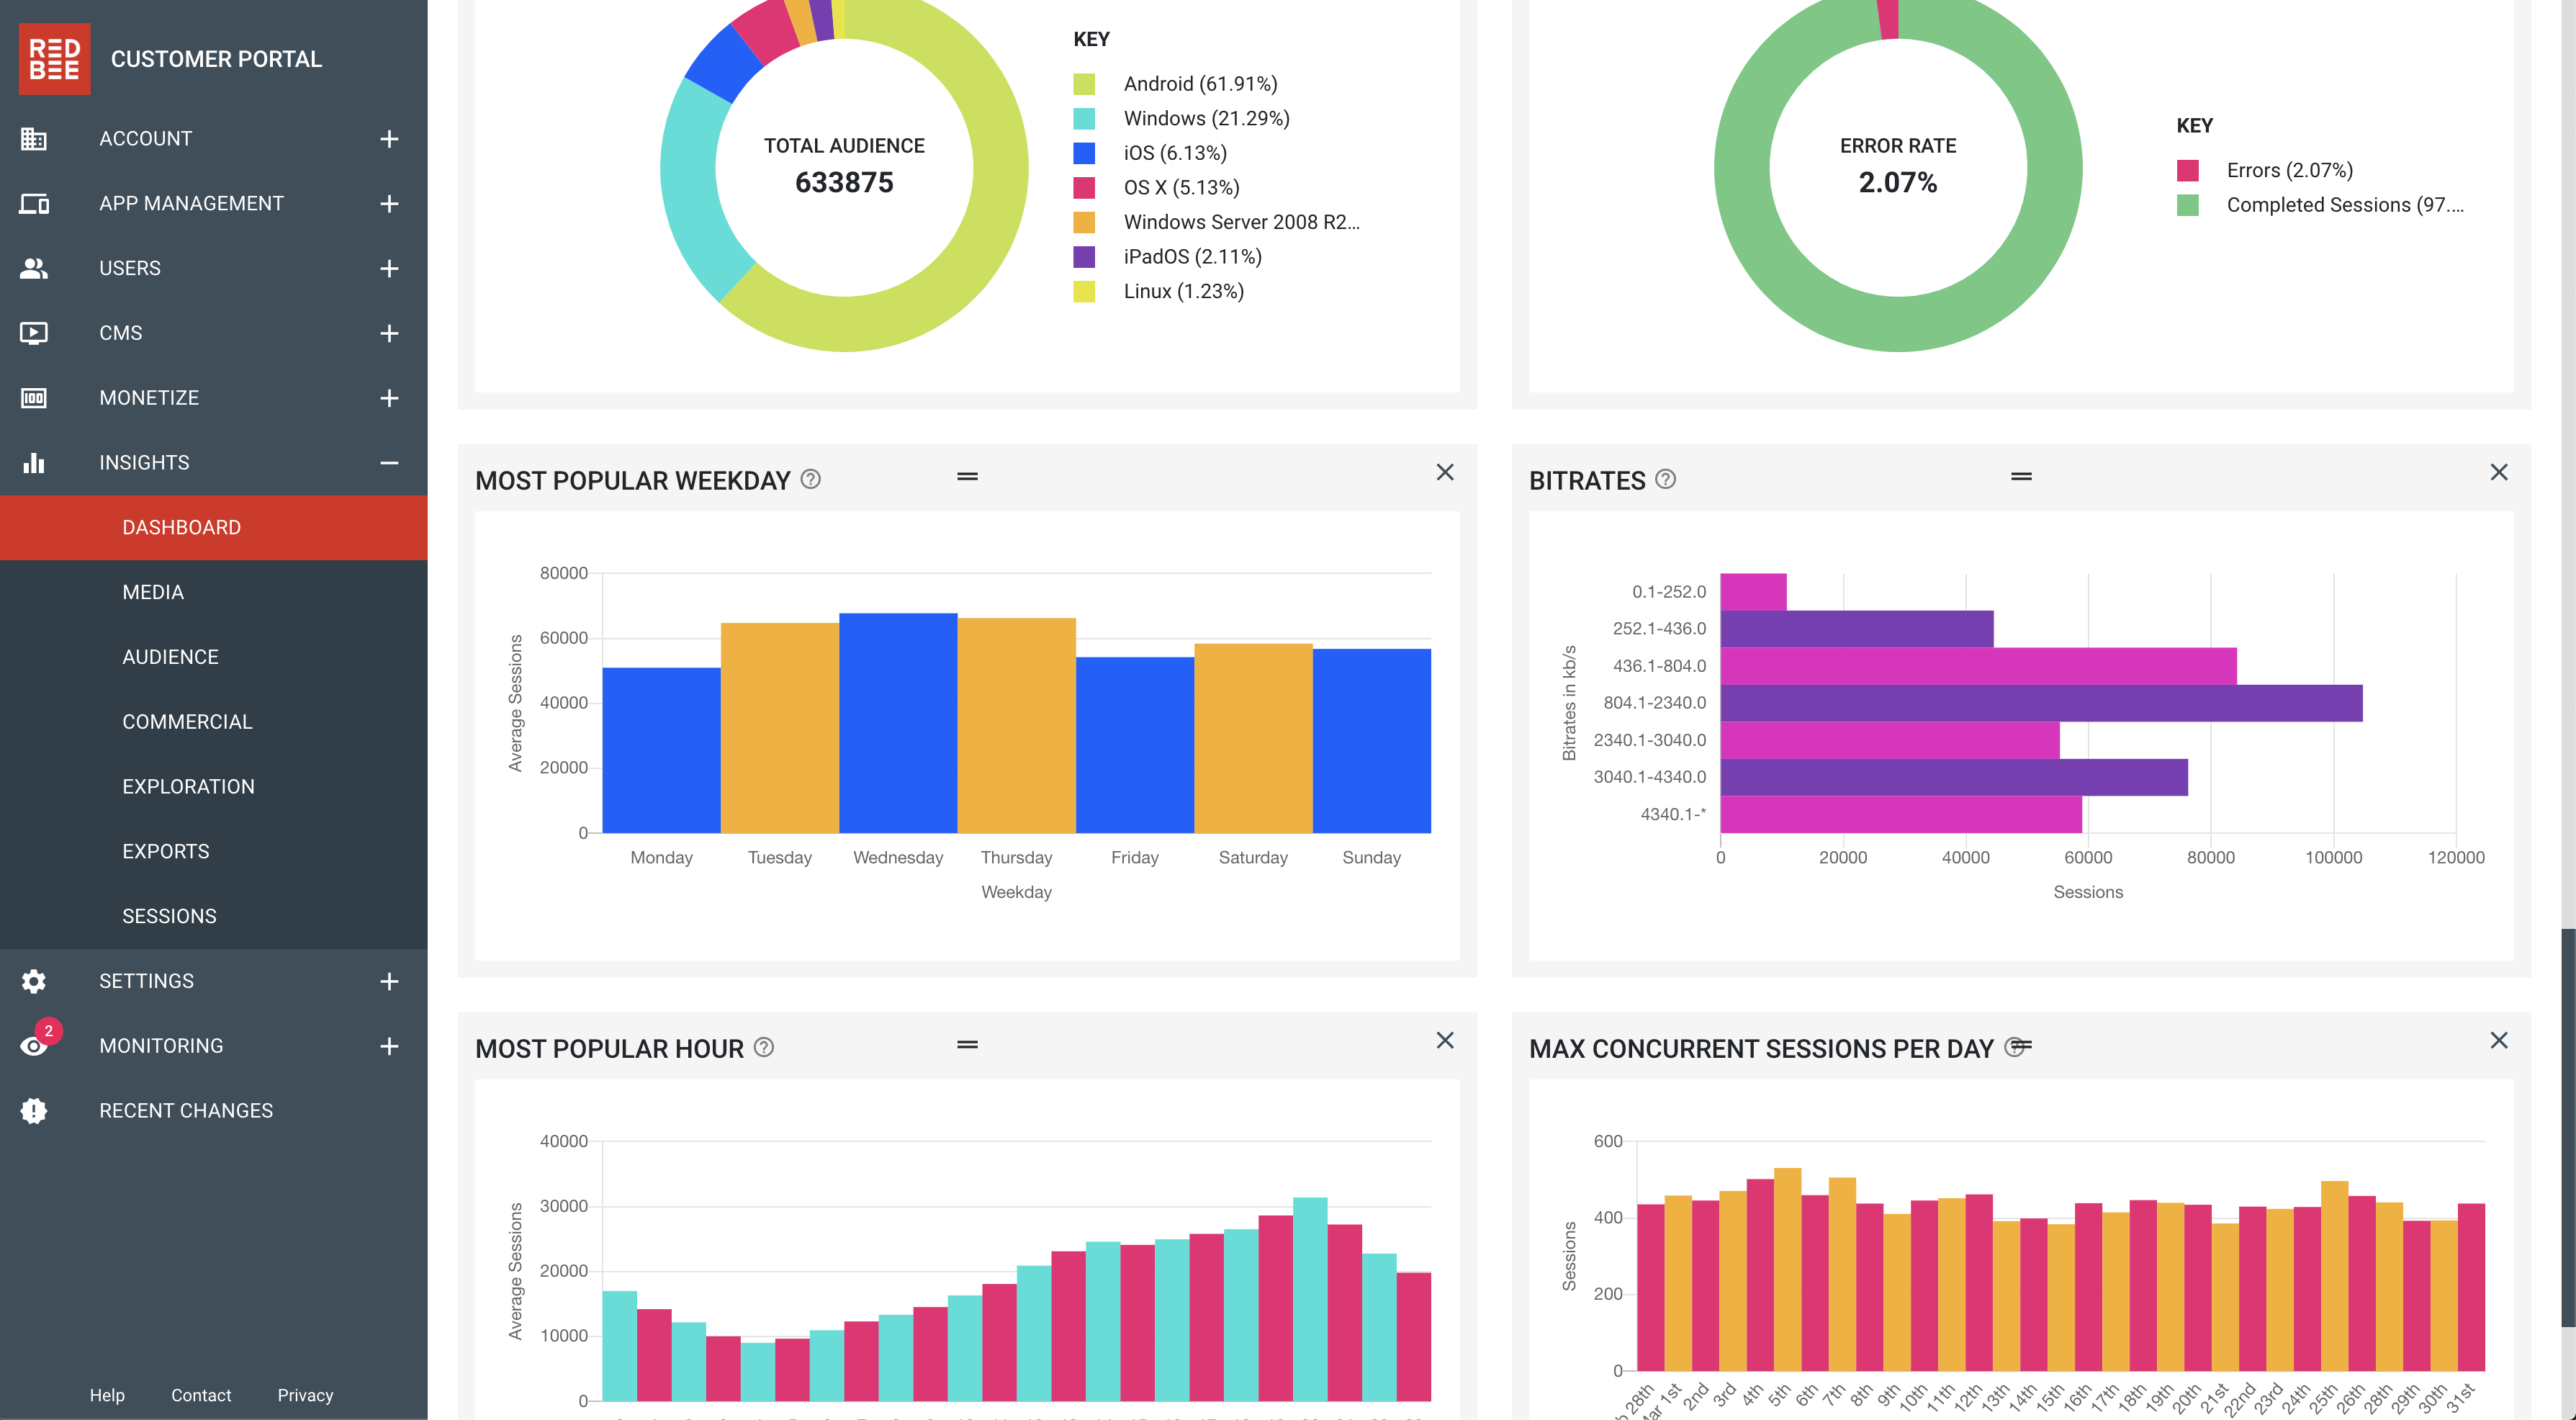
Our Insights is a part of the Customer Portal is where we visualize some of your analytics data using charts, maps and tables. We offer a customizable Dashboard where you can select from a variety of widgets and rearrange them as you wish to create your own analytics dashboard. We also offer an Exploration tool where you can use our Datapoints and Groupings to fetch analytics data from our system similarly to the Analytics API. These explorations along with our Predefined Exports can then be exported in CSV and XLS formats.
The Dashboard
Exploration