Exploration
The Customer Portal Exploration is a tool that allows you to fetch and export your analytics data from our system with a couple of clicks. Using our Datapoints and Groupings you get complete freedom to decide what data to retrieve and how to group it. The resulting data is then exportable and presented in a table. Explorations can also be saved, shared within your business unit and marked as an export to make them visible under Insights > Exports.
Note that if you are experiencing trouble fetching the data it could be due to the fact that it can take a long time to crunch the data. We recommend retrying after 30 seconds, the cached data might then be retrievable.
Getting Started
Creating a new exploration
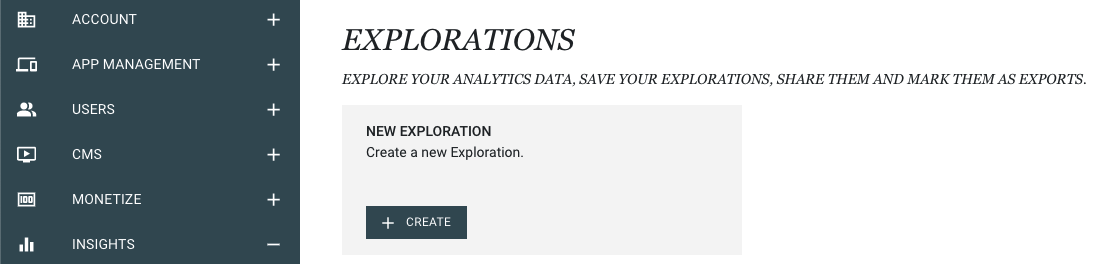 Clicking on
 Create with create a new blank exploration that we will use as our starting point.
Selecting Dates and Filters
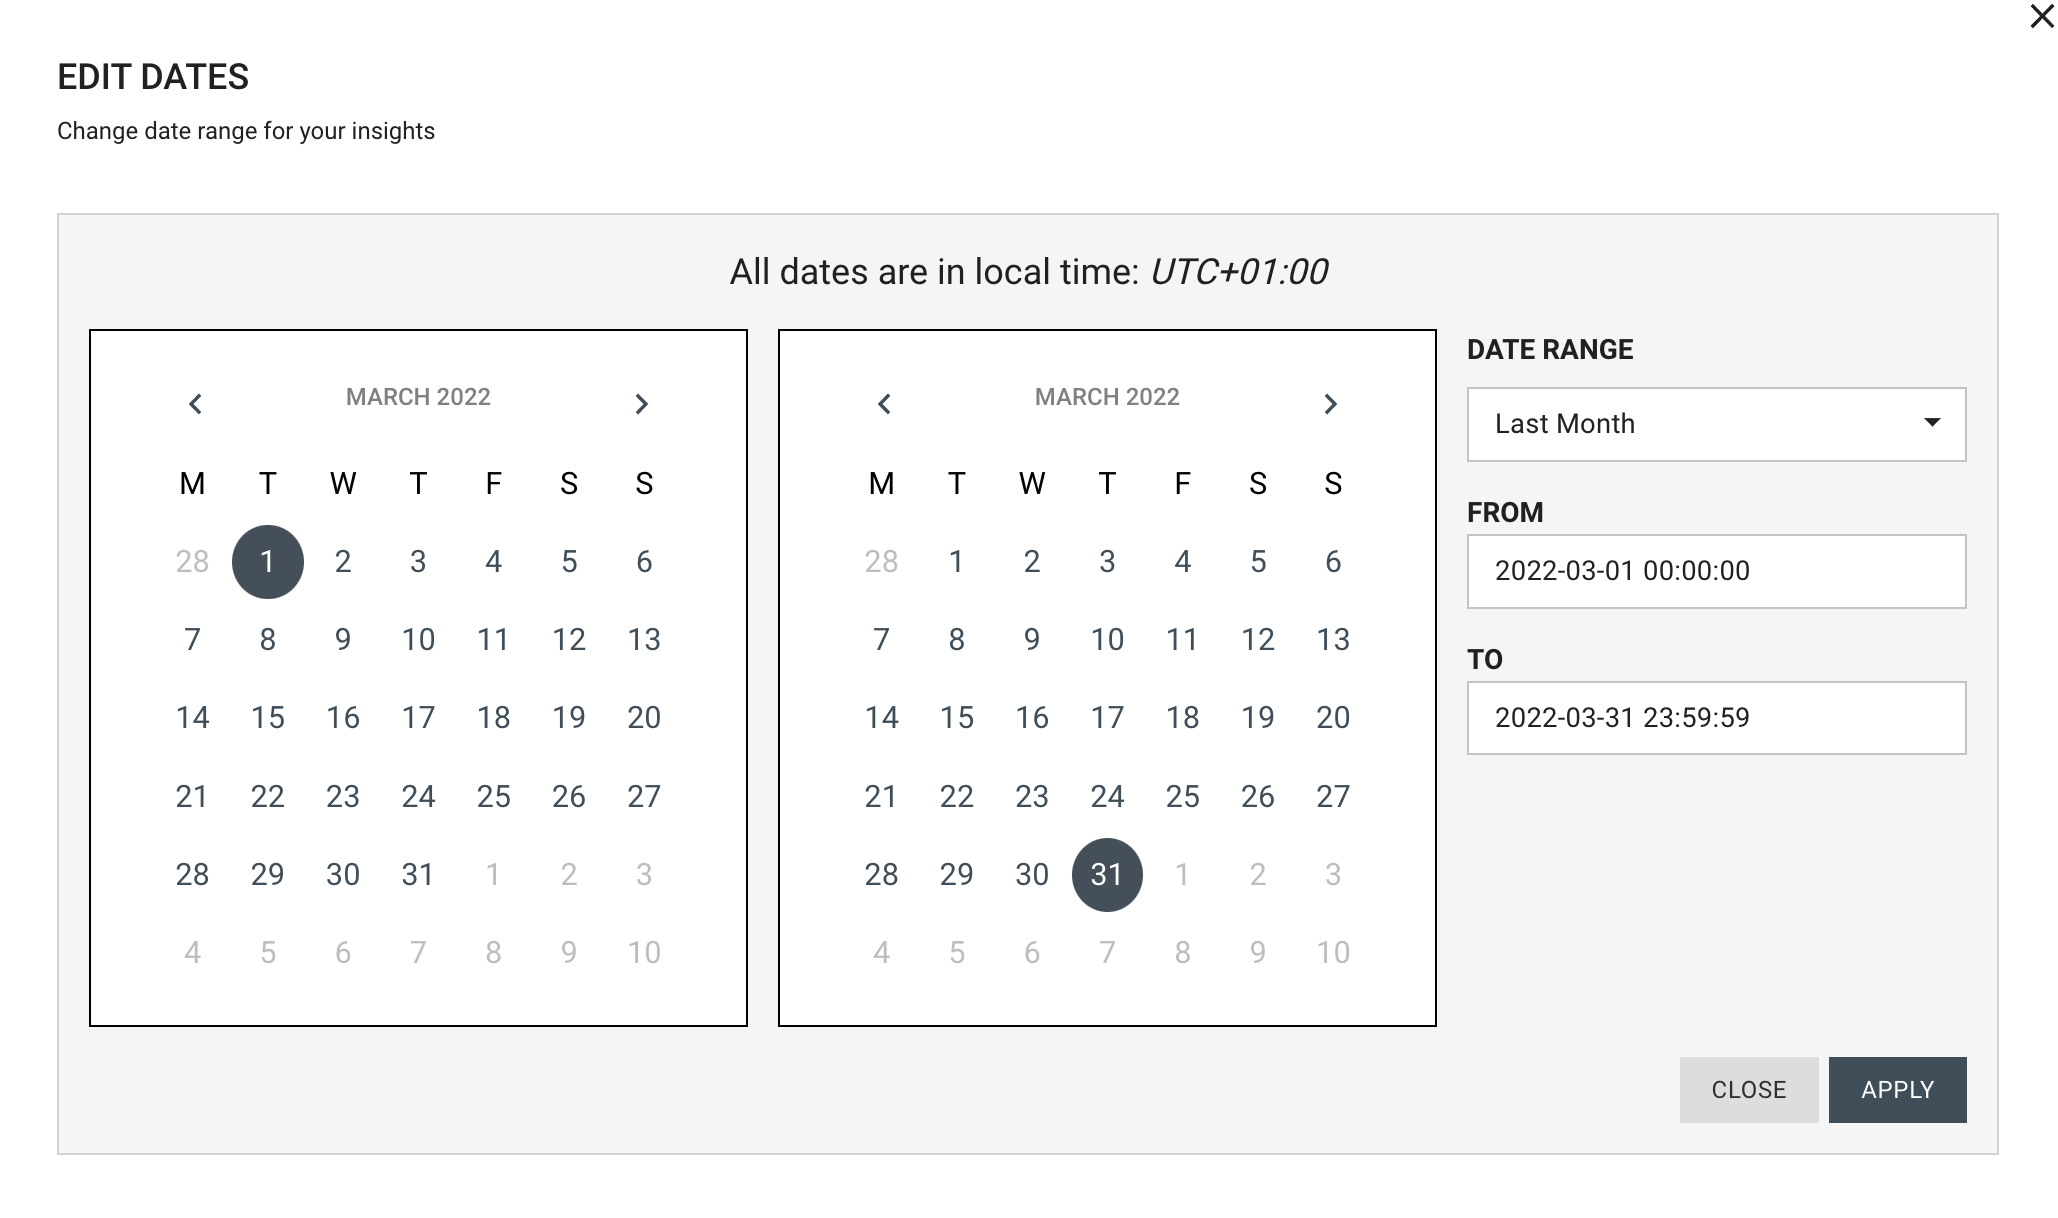
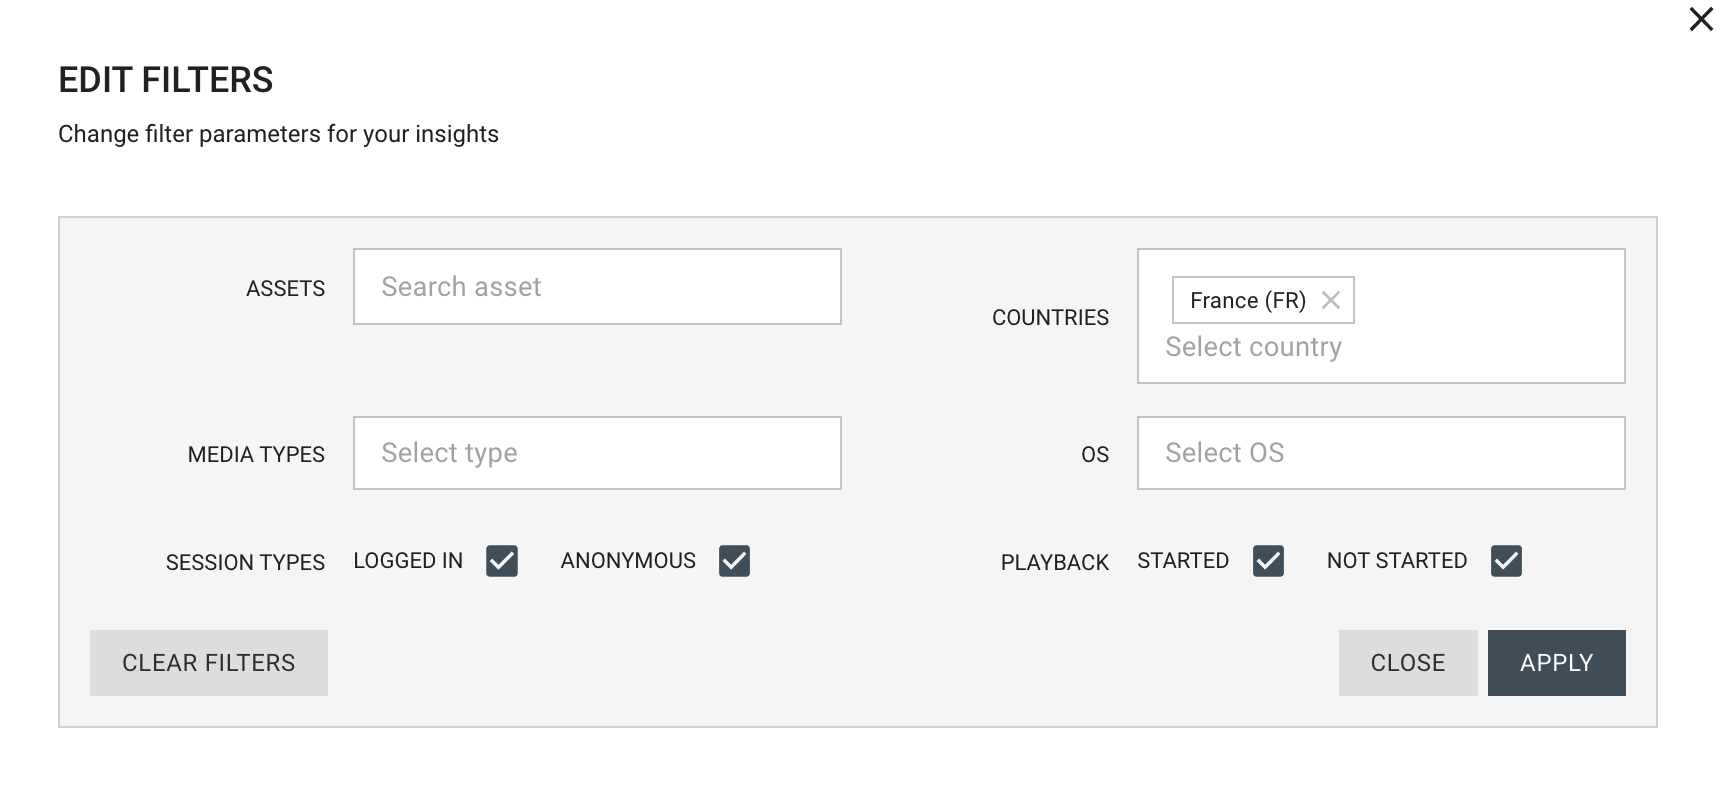
Using the Date Selector and Filter Selector you can delimit the data in time and filter it with our supported filters. More on how to use these selectors can be found in the Overview.
In our example we will be looking at data for "Last Month" and filter our data to only include data originating from viewing in "France".
Don't forget to "Apply" you selection!
Our dates selection
Our filters selection
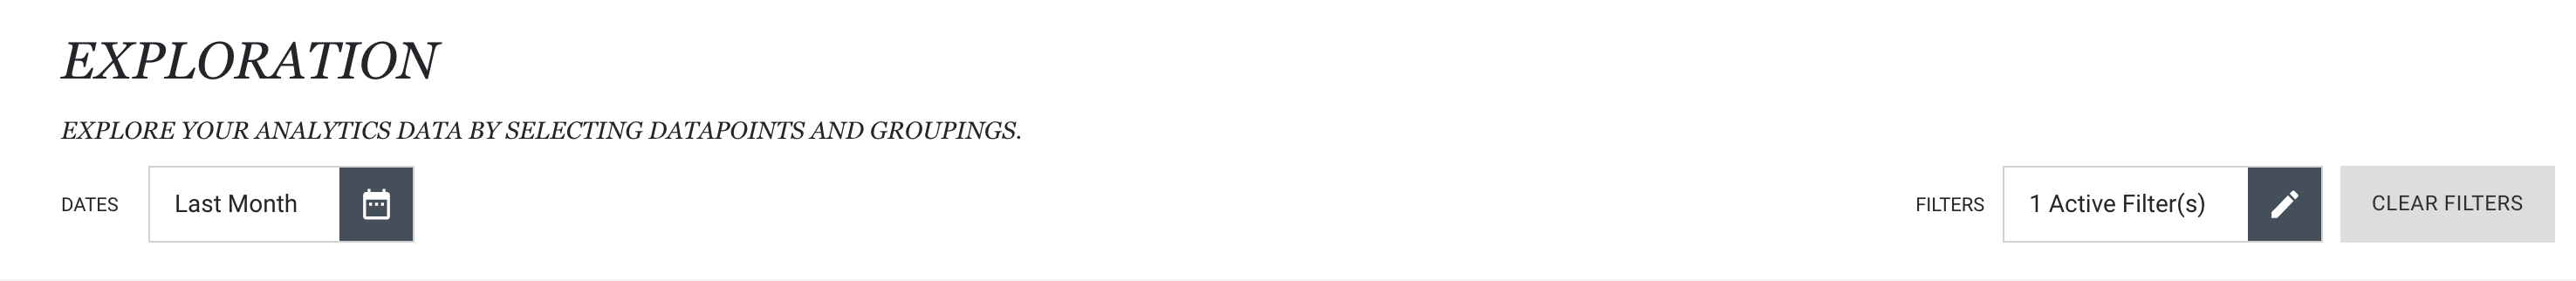
Date and filter overview
Adding Datapoints
Using the Datapoint Selector allows you to choose what datapoints you want to use to retrieve relevant data. You can find more information about all available datapoints under Datapoints.
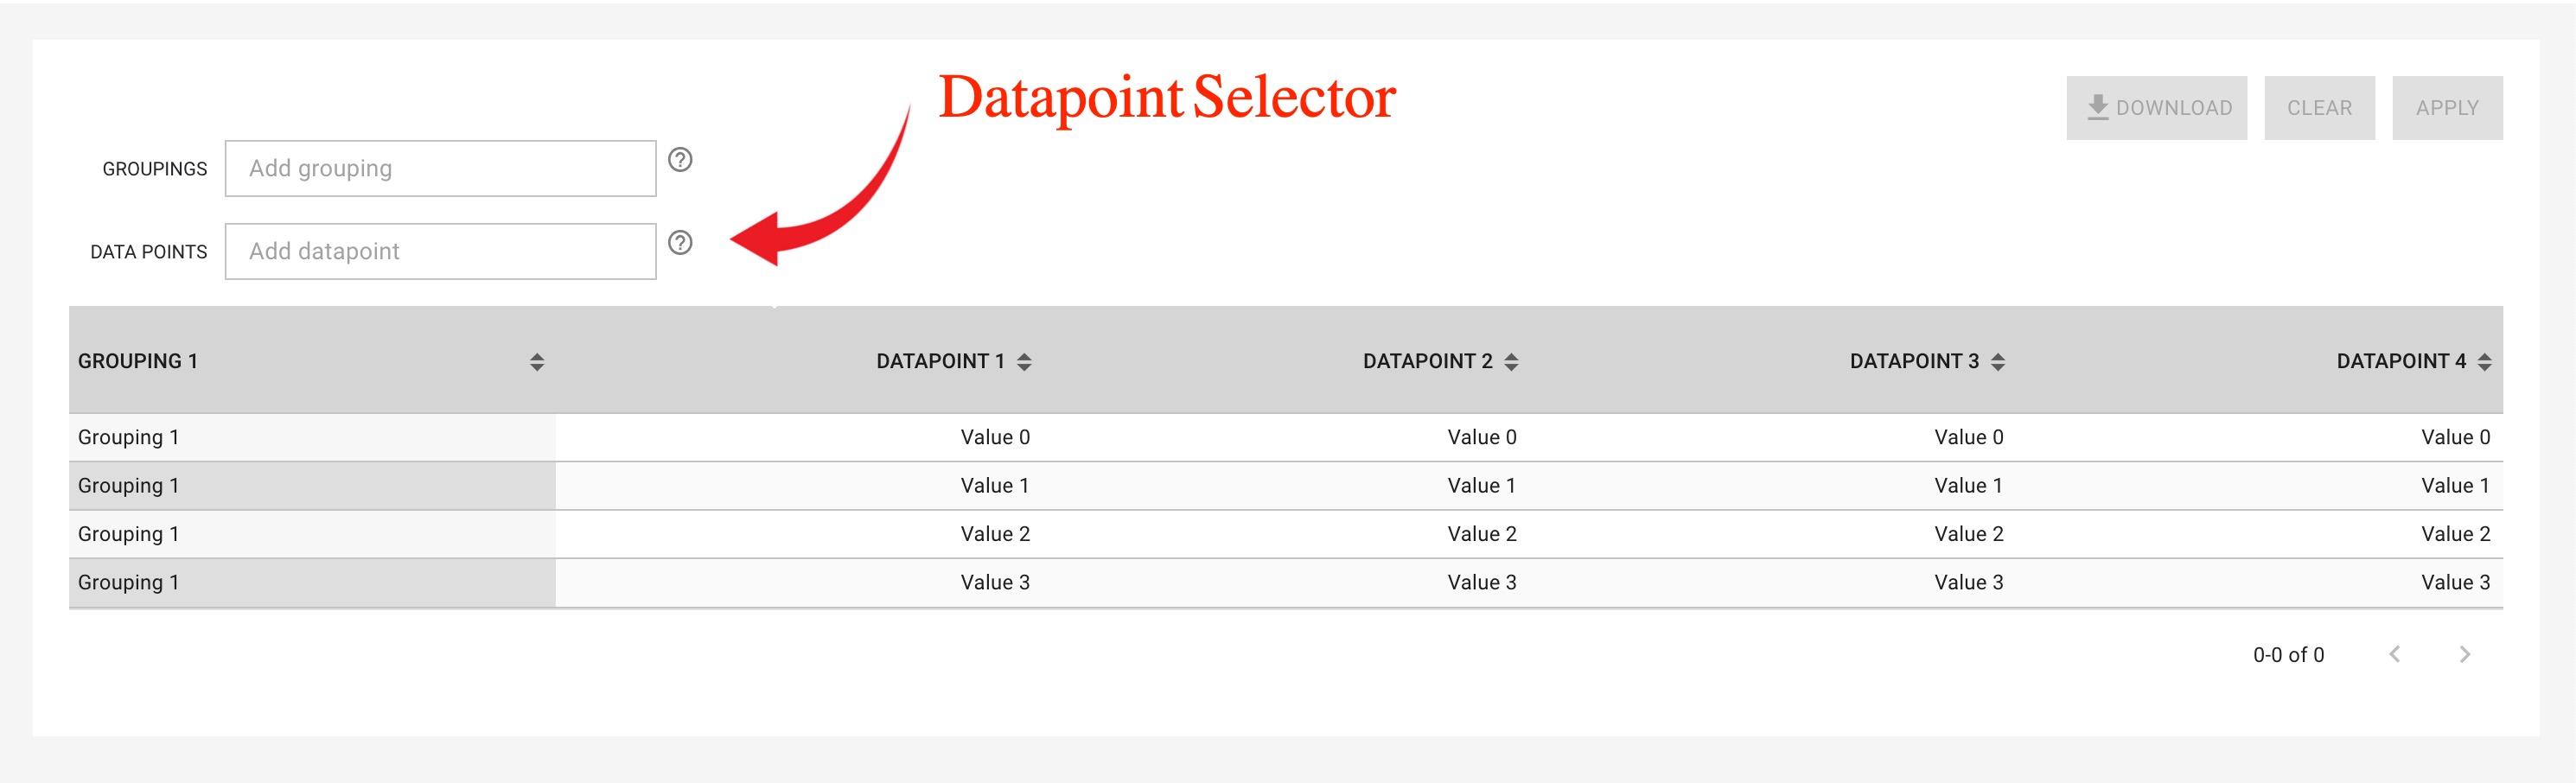
Let's continue with our example. Now that we have selected our date range and filters, let's start looking at some data. In this scenario we are interested in looking at the total number of sessions, the number of active users, the play completion ratio and the average startup time of playback. So let's add the corresponding datapoints. Don't forget to "Apply"!
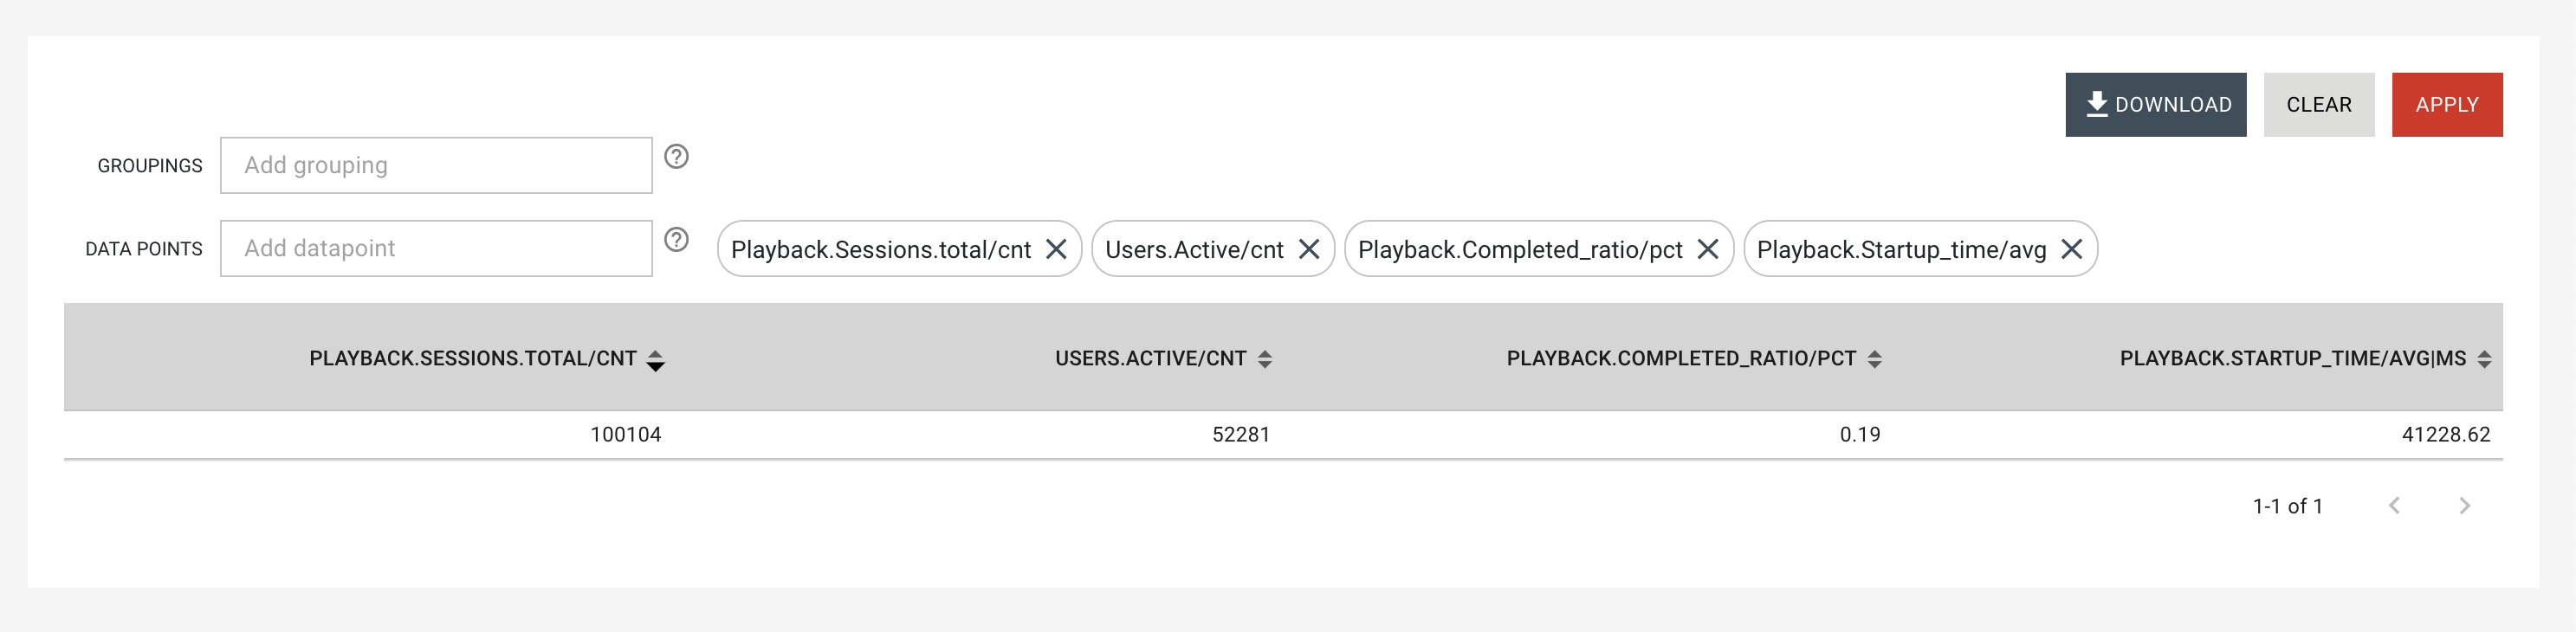
As we can see we only get value per datapoint. This value is an aggregation over all sessions that were recorded in "France" for "Last Month".
Adding Groupings
Using the Grouping Selector allows you to choose what groupings you want to use to group the data. You can find more information about all available groupins under Groupings.
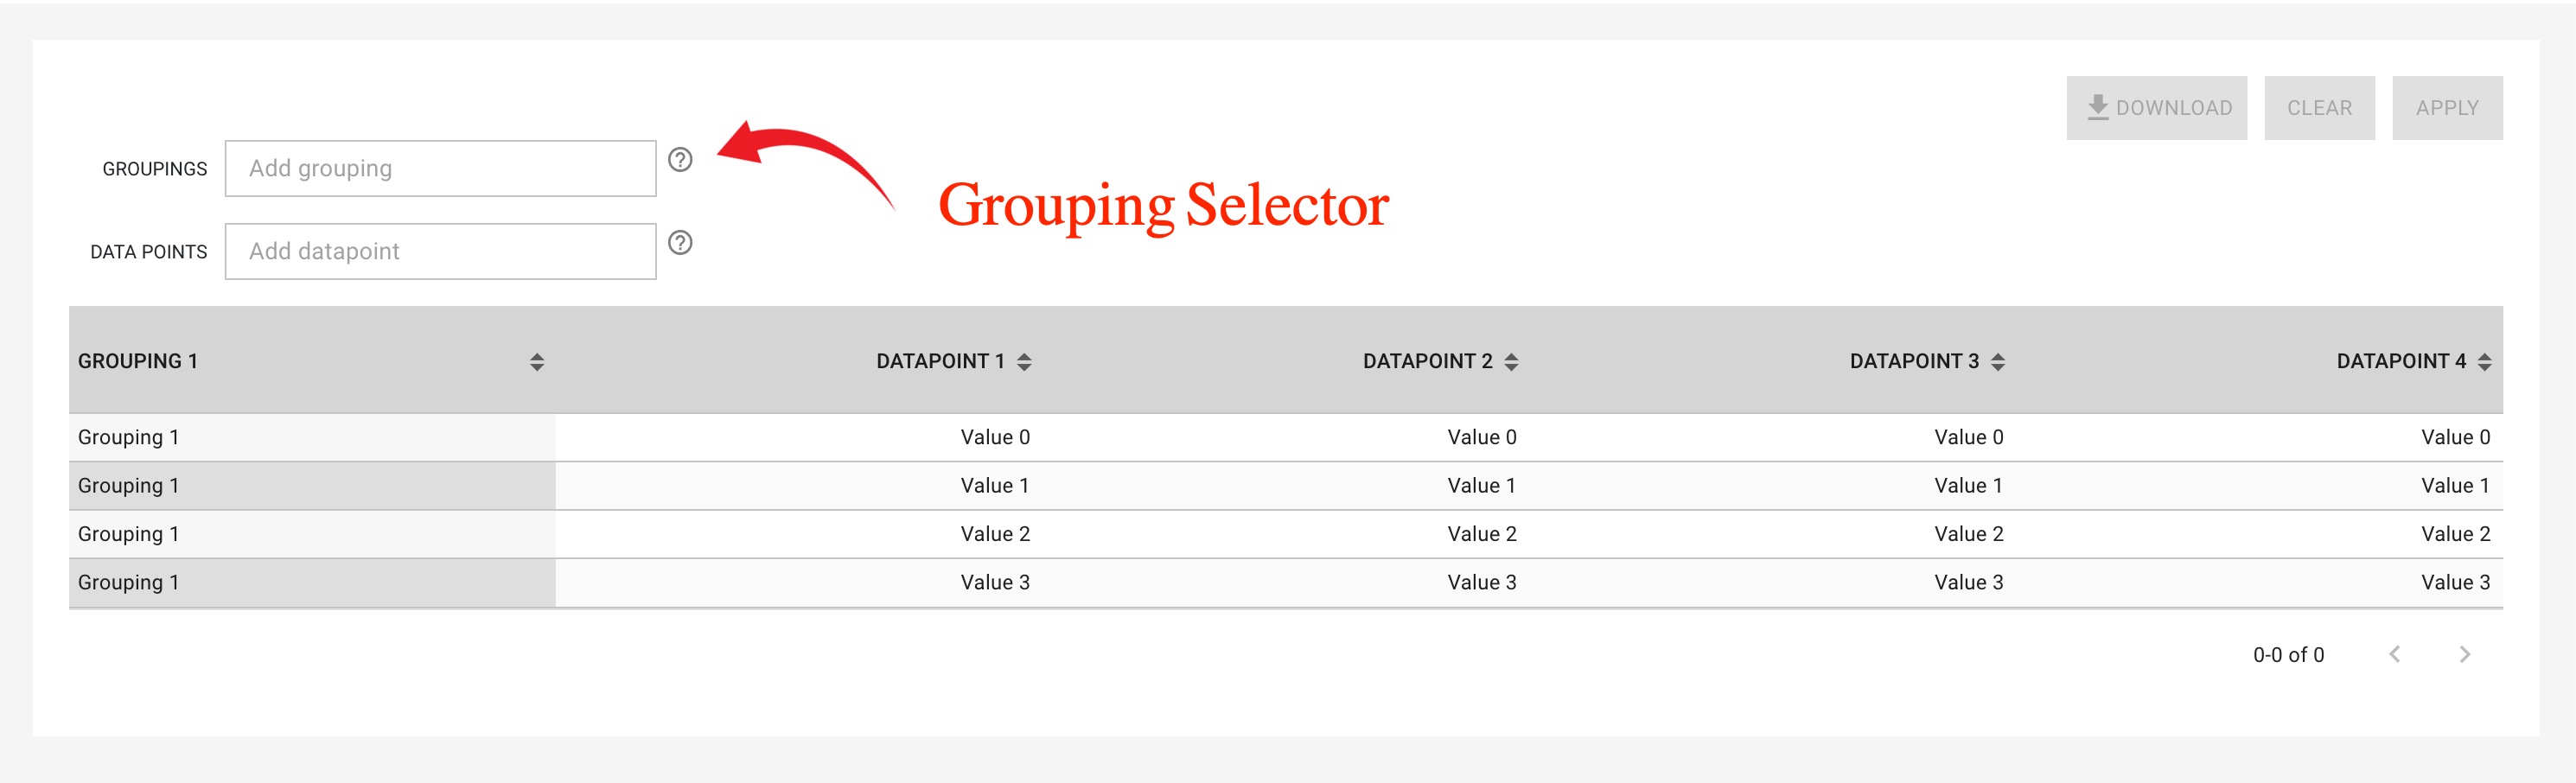
Let's continue with our example. Now that we have selected our relevant datapoints let's group the results. In this scenario we are interested in looking at the same datapoints per Asset ID. So let's add the corresponding grouping. Again, don't forget to "Apply"!
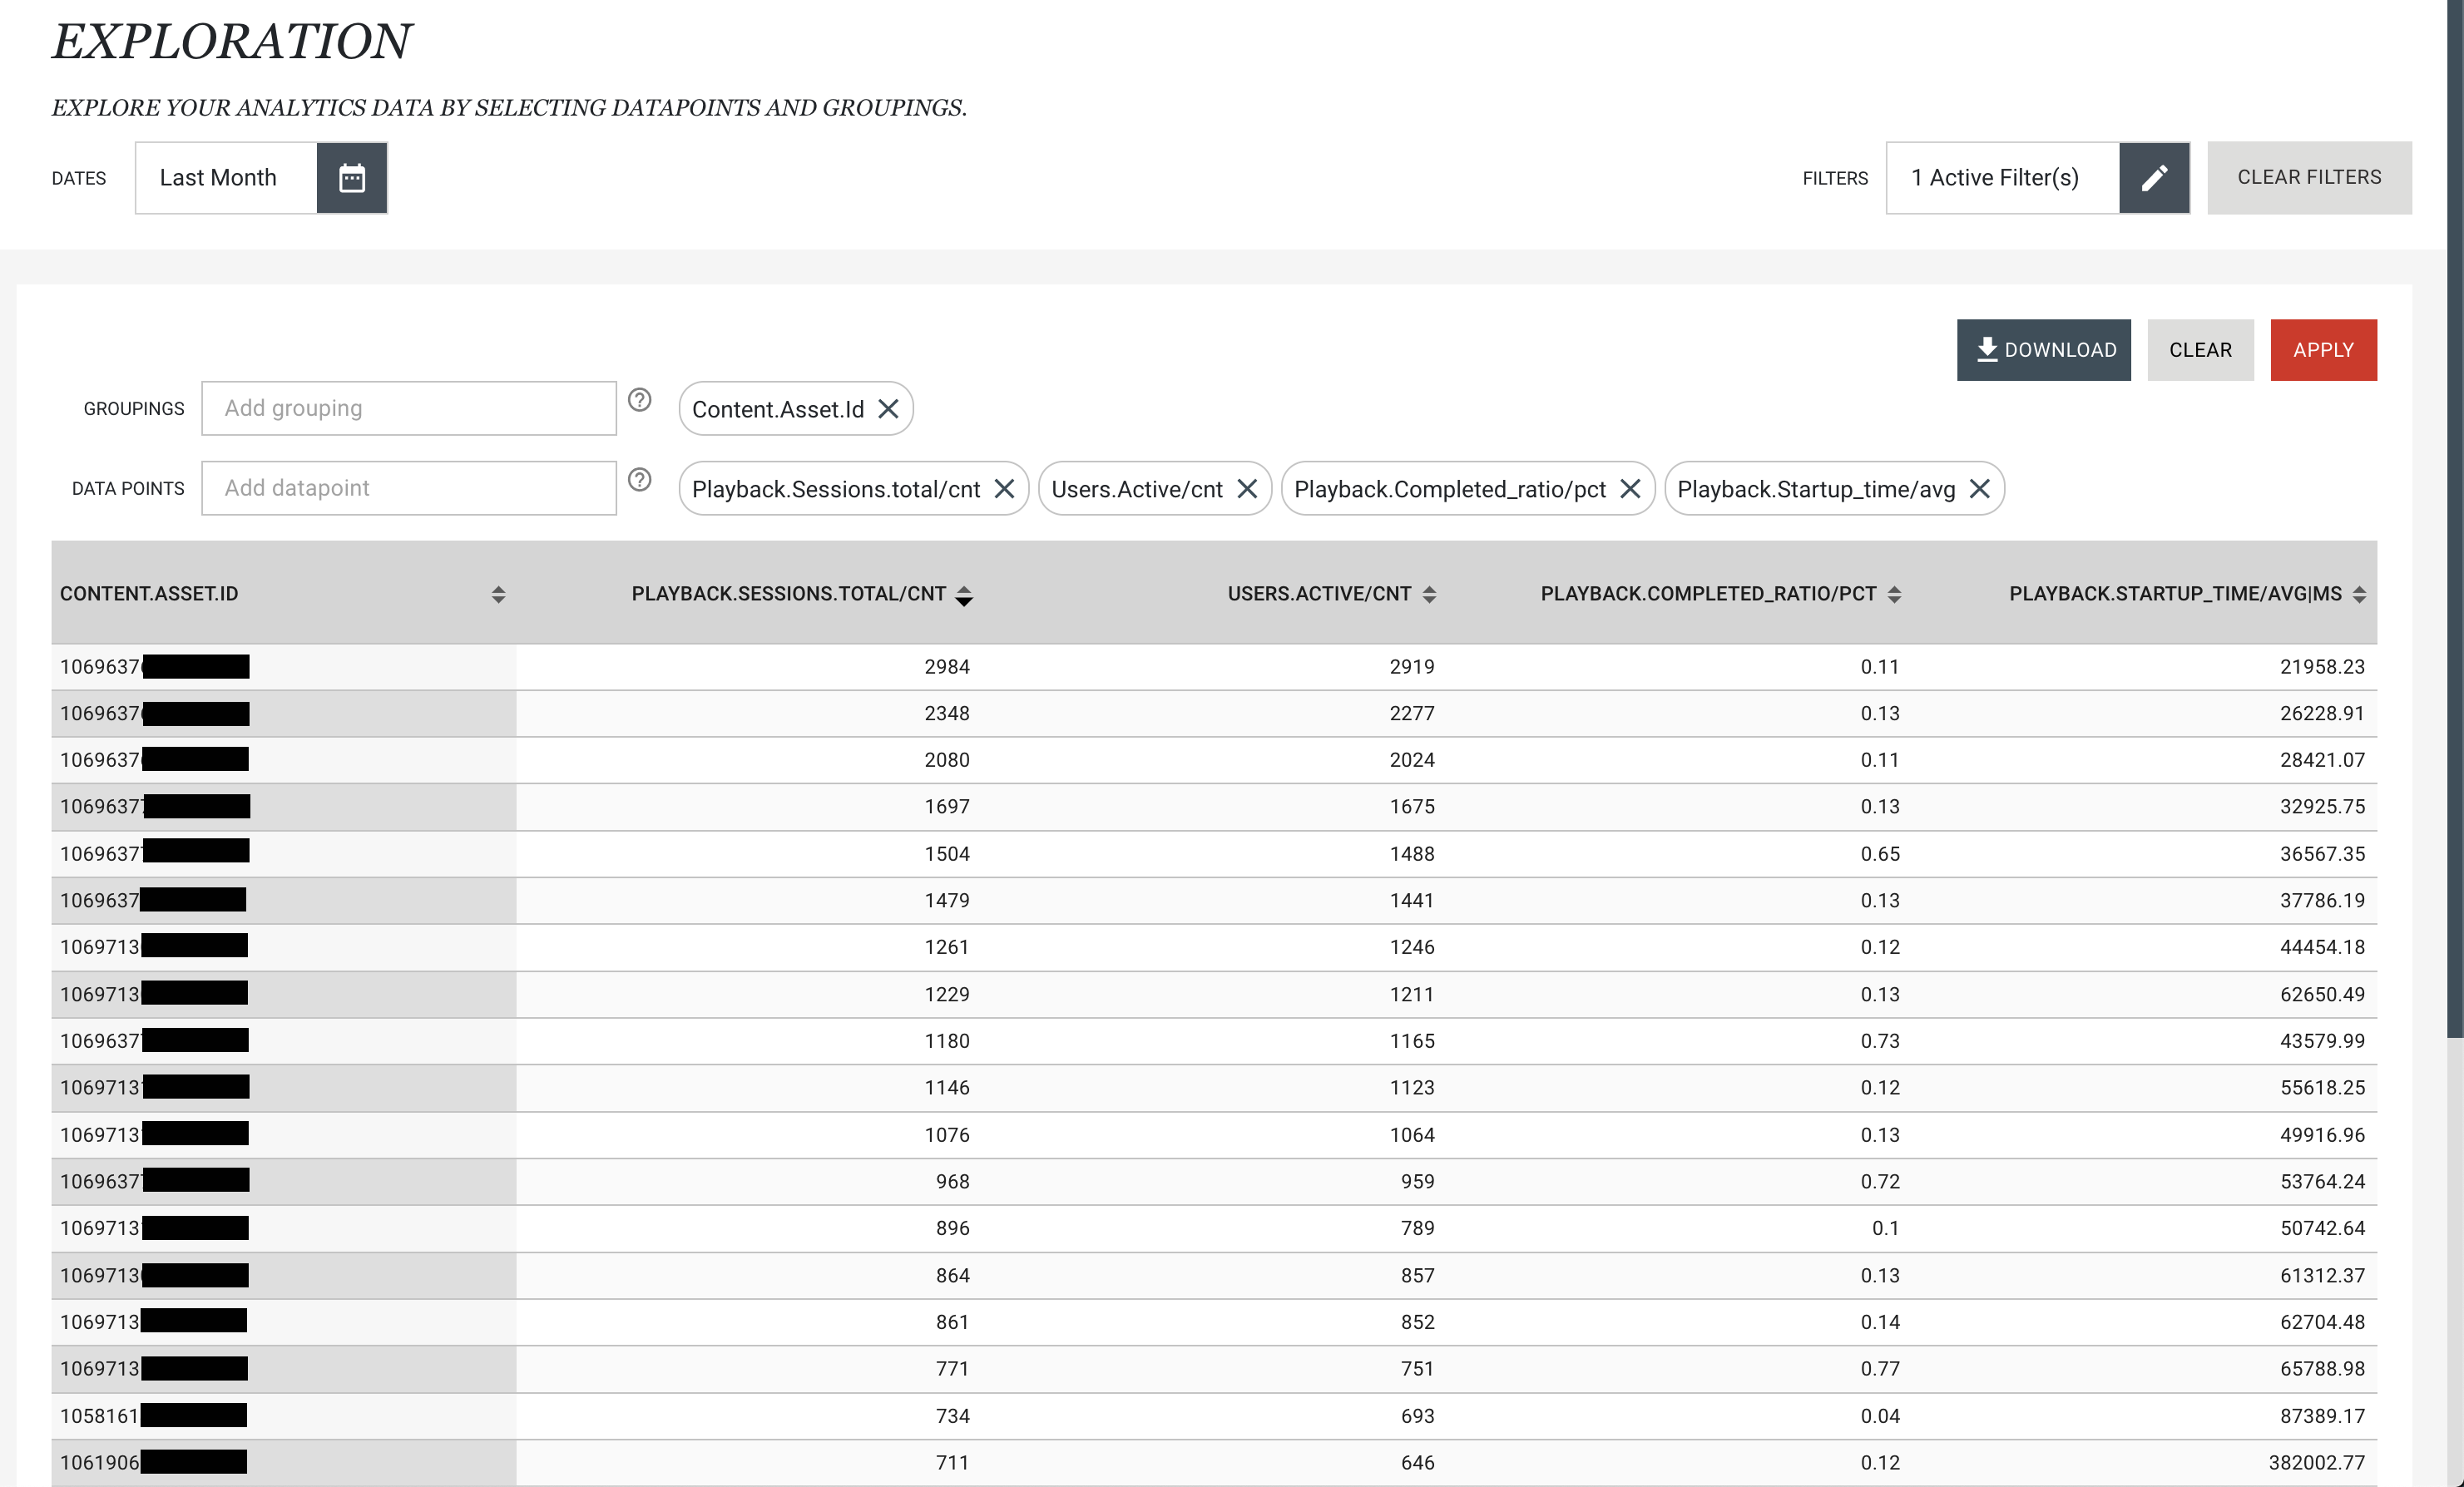
As we can see the data is now grouped by Asset ID. We can see the values for each datapoint per Asset ID
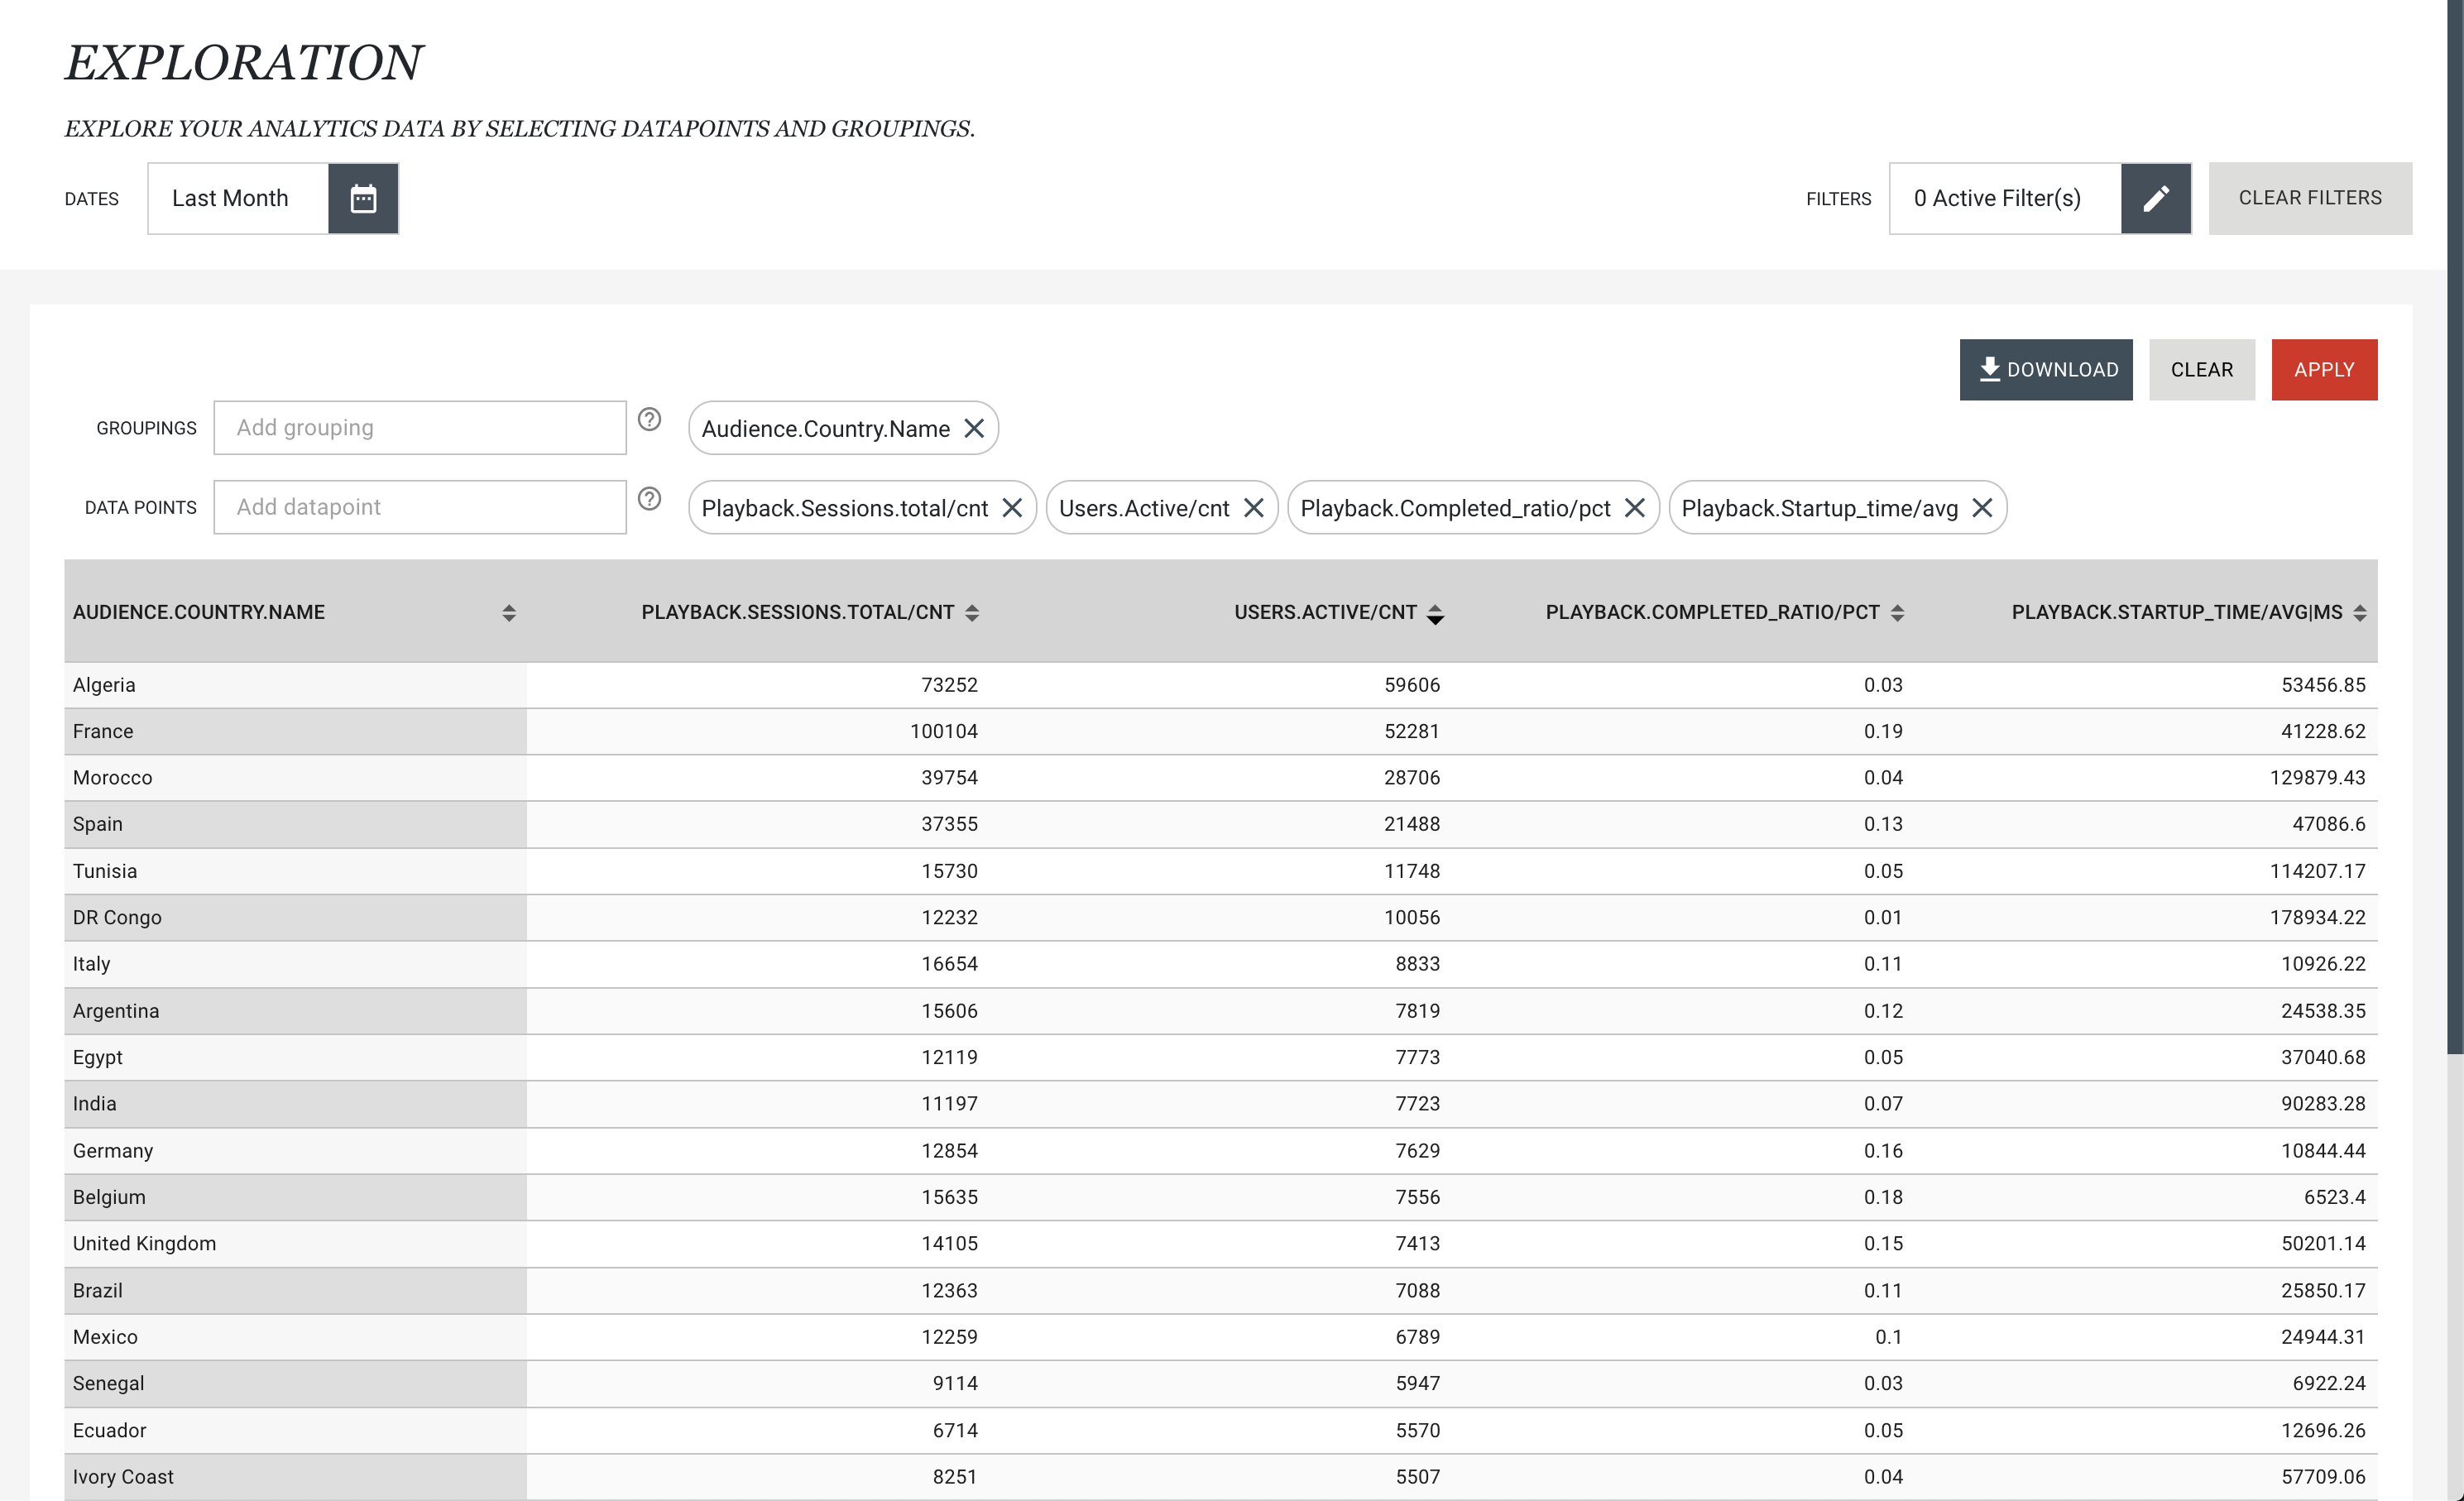
Let's change grouping! I want to see data for the same datapoints but per Country instead of per Asset ID. So let's change our grouping to the Country Name grouping and "Apply".
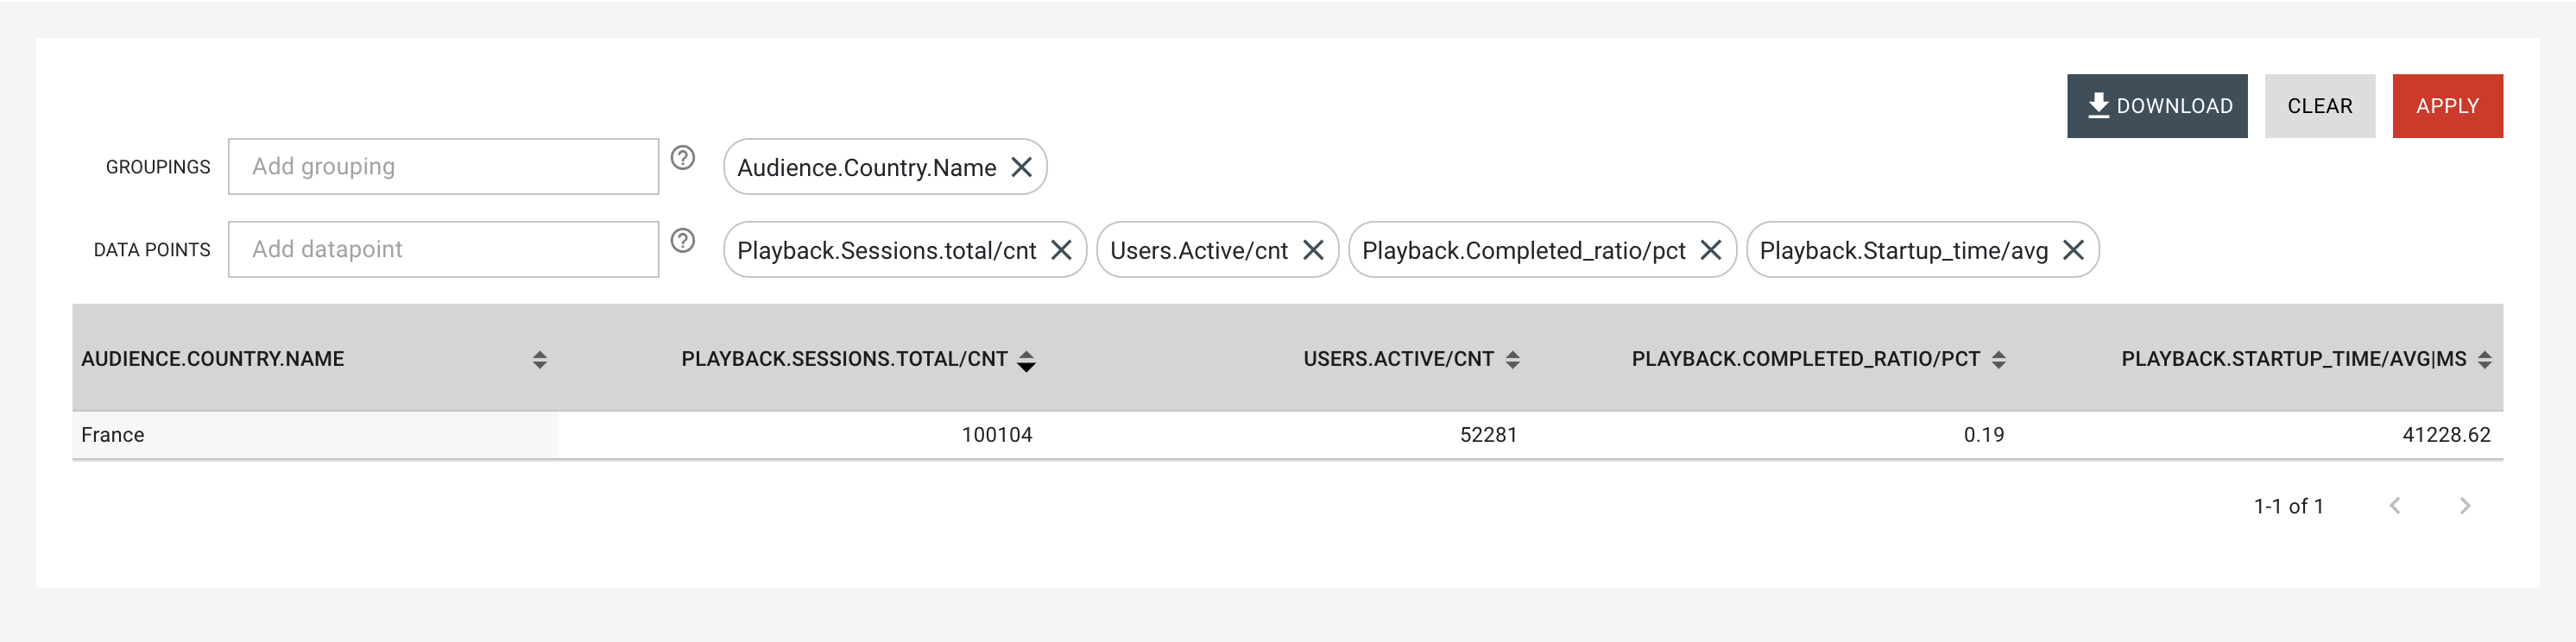
Hmmmmm, strange... We only get 1 row here for "France" but we know that we have active users in at least 15 countries! What happened?
Remember our filter selection? We are using the country filter so that we only see data for "France". Ahh! So let's clear our filter selection using the Clear Filters button.

Now we see our unfiltered data and all the expected countries are present. Be aware of your date and filter selection!
Note that it is possible to use multiple groupings!
Sorting
Using the small arrows in the table headers next to the table header name allows you to sort the data. The arrow that is bolded indicates the current sorting. A downwards arrow means that the current sorting order is descending whereas an upwards arrow means that the current sorting order is ascending.
In our example we can see, in the image above, that we have a descending sort oder and sorted the data by total sessions. Let's change our sorting! In this scenario we want to keep our descending sort order but sort by active users. Let's click once on the arrows in the active users table header.
We have now sorted our data by the number active users using a descending sort order.
Looking at the 2 previous images we can see that the country with the most sessions is not the country with the most active users. Interesting!
Options
Clicking on the options button will open the options modal.
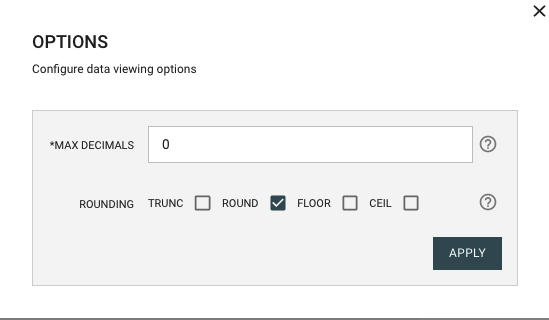
Here you can decide the Maximum number of decimals as well as what Rounding method to use for numerical data point values.
Exporting
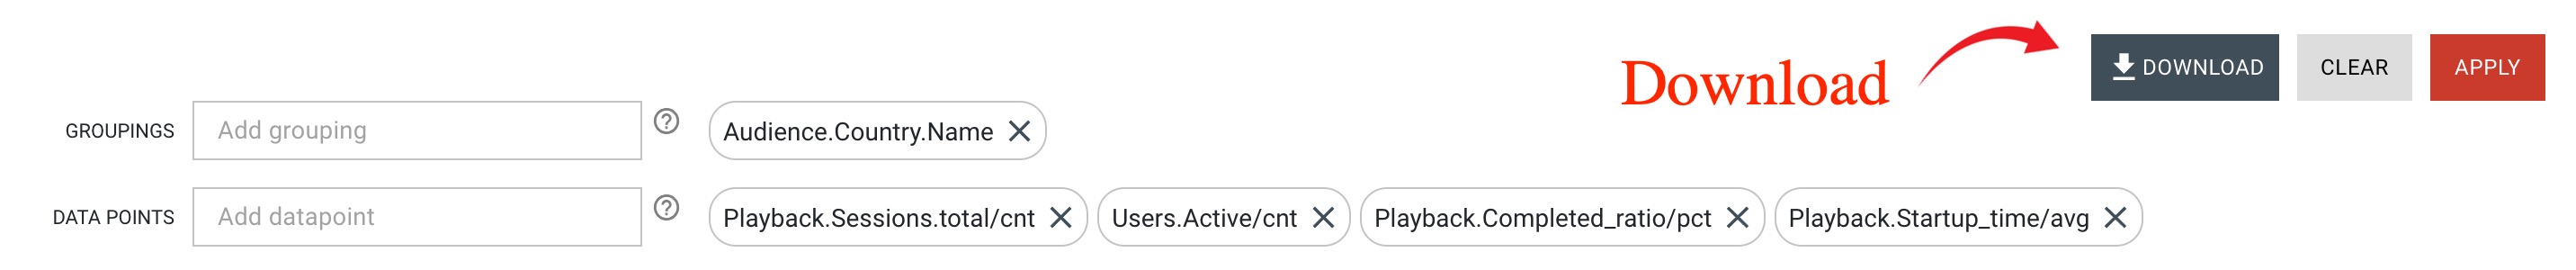
Using the Download button allows you to export data from our system using the current Dates Selection, Filters Selection, Datapoints Selection and Groupings Selection.
Once you've clicked on the Download Button a modal will open.
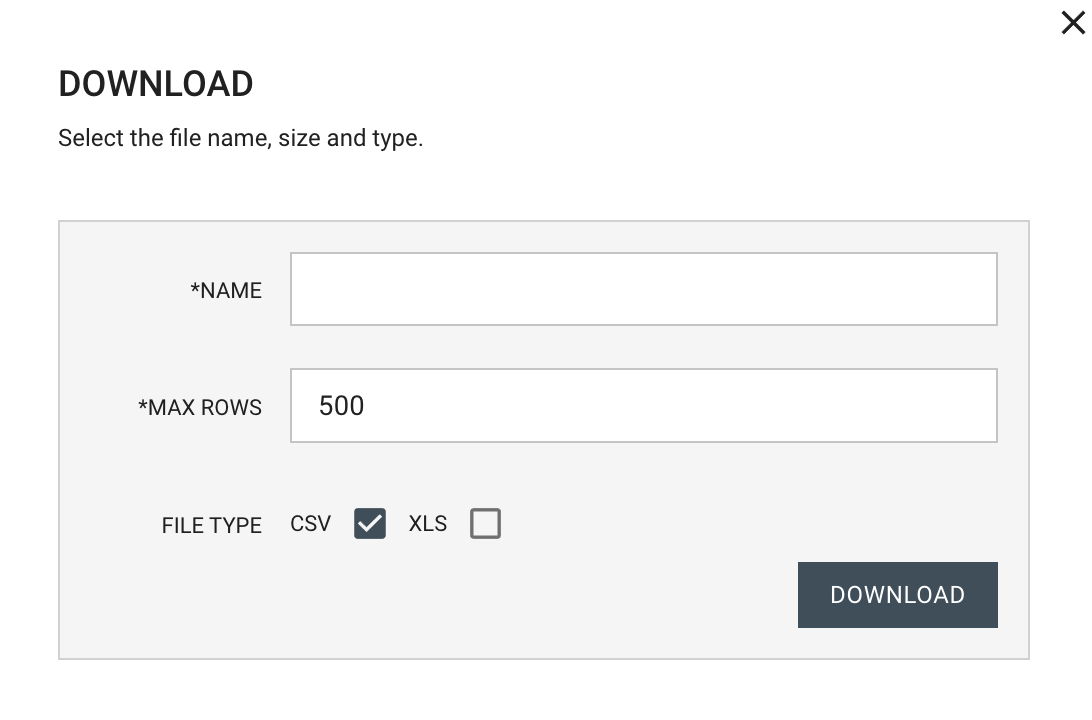
Here you must add:
Name- Used as the exported file name.Max Rows- Used to limit the data to a certain number of entries.File Type- Used to determine the file type. We currently support CSV and XLS types.
The downloaded file will end up in your designated Downloads folder.
Note that fetching very large amounts of data (>1000 rows) can take a long time or even generate errors. If that is the case we recommend waiting 30 seconds and trying again, the cached data might then be retrievable.
Saving the exploration
Explorations can be saved, shared within your business unit and marked as an export to make them visible under the Exports page. So let's do that! Clicking on the Save button will open the save modal.
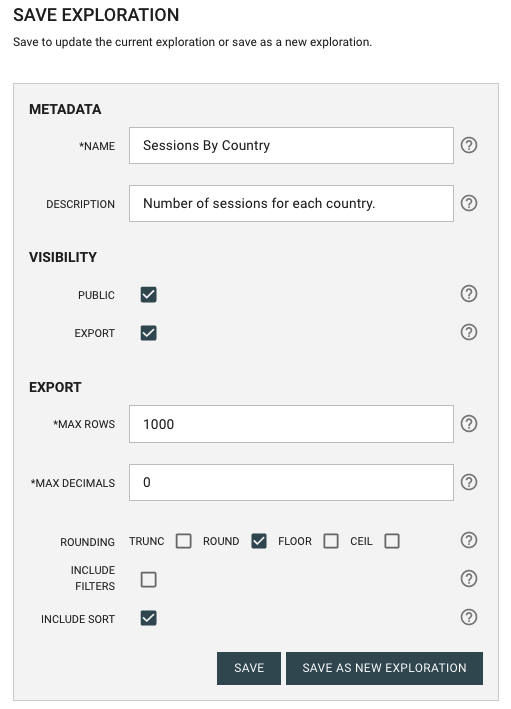
As the owner of the current exploration you will be able to Save to update the current exploration. Anyone can save the current exploration as a new exploration. This allows you to use already existing explorations as a starting point for your new exploration.
Here you can add:
Name- Used as the name of the exploration as well as the name of the exported file if it is marked as an export.Description- Used as the description of the exploration. It is visible in the explorations listing.Public- A flag used to share the current exploration with everyone within your business unit. Only the owner of the exploration can update it.Export- A flag used to set the current exploration as an export. This will make it visible under Insights > Exports.Max Rows- Used to limit the exported data to a certain number of entries.Max Decimals- Used to limit the number of decimals of numerical data point values. This will be used when exporting data.Rounding- Used as rounding method for numerical data point values. This will be used when exporting data.Include Filters- A flag used to include the current filter selection to the exploration. This will be used when exporting data.Include Sort- A flag used to include the current sorting order to the exploration. This will be used when exporting data.
Once the exploration is saved it will be visible under Insights > Exploration. There you will find all your explorations and well as the ones that have been created by others and made public within your business unit.